How to pick a long-term winner stock
The key to picking a winner stock is to know the real worth of the stock. The way of doing it is by using the power of knowledge to make informed investing decisions. Fundamental analysis provides us with this knowledge. Fundamental analysis is a method of assessing the intrinsic value of a stock by analyzing various economic and financial factors.

There are two main types of fundamental analysis –
- Qualitative: a study that involves brand value, management decisions, the financial performance of the company over a given period, and other similar factors.
- Quantitative: an analysis that is purely number-based and considers the company’s financial statements and concludes the share price from the observations.
Although the methods differ, they are both essential for a thorough evaluation of a company’s share price.
Components of Fundamental Analysis
- Economic analysis
- Industry analysis
- Company analysis

Where economic analysis covers the macroeconomic factors like the GDP, inflation in the economy, prevailing interest rates and overall stability of the economy. The industry analysis covers the government regulations in the said sector, the competitiveness in the industry etc. The final pillar is the company analysis which involves studying the financials of the company, historical earnings and profit margins to project future growth. It is a process carried out by investors to evaluate securities, collecting info related to the company’s profile, products and services as well as profitability.
Critical parameters to consider while performing Fundamental Analysis
Fundamental Analysis is about understanding a company, the health of its business, and its forecasts. Fundamental analysis is designed for investors looking for excellent long-term returns.
Following are the important factors to consider while choosing the right company to invest in.
Price to Earnings Ratio
The P/E ratio for a stock is computed by dividing the price of the stock by the company’s annual earnings per share.
The P/E ratio can reveal a lot about how investors feel generally about a certain stock. However, it is vital to compare the current P/E to prior P/E ratios as well as P/E ratios of other firms in the same industry in order to determine whether a company is relatively overvalued or relatively undervalued.
In general, if the current P/E is at the lower end of a company’s own historical P/E range, or if the company’s current P/E is below the average P/E of similar companies, it may be a sign that regardless of recent business performance, the stock may be undervalued.

Dividend Yield
Dividend yield is the financial ratio that measures the quantum of cash dividends paid out to shareholders relative to the market value per share. Dividends can be a great source of passive income. And people looking for a regular income from investments can invest in stocks with a high dividend yield. If a firm’s dividend yield has been rising steadily, it may be because the company is raising its dividend, its stock price is falling, or both. Investors could see this as either positive or negative, depending on the situation.

Earnings Per Share
EPS is an important financial measure, which indicates the profitability of a company. It is calculated by dividing the company’s net income with its total number of outstanding shares. The EPS metric is one of the most significant variables in analyzing a stock price. A consistent EPS growth may indicate the company’s profitability, suggesting its ability to pay higher dividends over time.

Dividend Payout Ratio
A company’s dividend payout ratio is the percentage of that company’s earnings that it pays out to its investors as dividend income. Stocks that pay dividends can be a terrific source of passive income. Investors can use the dividend payout ratio to identify businesses that have the flexibility to consistently reward them with higher dividend income in the future. Dividend payout ratios tend to vary with industry. The companies operating in mature, slow- growing sectors with not much need to retain earnings have a good DPR of 75%, whereas for the companies operating in volatile and fast-growing sectors the DPR between 30% to 60% is considered safe.

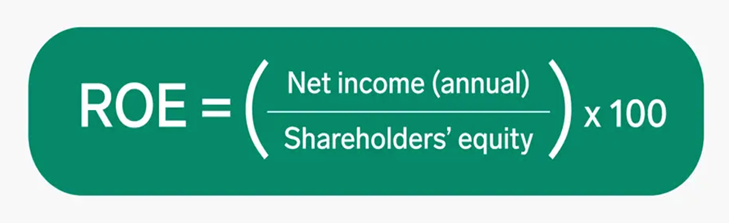
Return On Equity
ROE is a measurement of how effectively a business uses the money contributed by its shareholders to produce income. In other words, ROE indicates a company’s ability to turn equity capital into net profit. ROE measures profit as well as efficiency. A rising ROE indicates the company may be expanding its profit generation without needing as much capital.
A higher ROE is often preferable, while a declining ROE could signify less effective use of equity capital.
Price/Earnings-To-Growth Ratio
The P/E ratio is a good fundamental analysis indicator but its exclusion of projected earnings growth limits its usefulness as a fundamental analysis tool. By projecting the stock’s one-year profits growth rate, the PEG makes up for this. By examining a company’s previous growth rate, analysts can predict its future growth rate. By dividing the stock’s P/E ratio by the company’s growth rate, an investor can better understand whether a company’s P/E ratio will change in the future, creating a situation where the price stock either provides greater value or the stock price goes up.

In conclusion, no single tool or ratio can provide a complete picture of the company. These are just tools and have to be weighed in with other consideration but these numbers can serve as benchmarks to help you measure and compare different companies.